Your map data is talkingheres what its saying about pricing risk
Turning Data Into a MAP Enforcement Advantage
Clear Visibility Into Pricing Compliance.
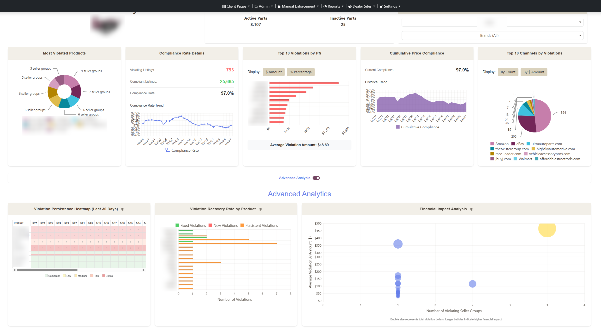
Our Parts Summary dashboard gives teams an immediate view of a brand’s pricing health across the client’s active product catalog. By showing active and inactive product counts, compliant listings, violating listings, and an overall compliance rate, the dashboard makes it easier to understand pricing performance at scale. Instead of manually reviewing marketplace results or relying on reports, users can quickly see whether advertised prices are generally aligned with the client’s MAP policy.
Our compliance trend charts add important context by showing how performance changes over time. A single compliance number is useful, but a trend line helps reveal whether enforcement actions are improving seller behavior, whether violations are increasing, or whether specific time periods need closer review. This helps teams move from basic monitoring to ongoing performance management.
Faster Prioritization of Problem Products
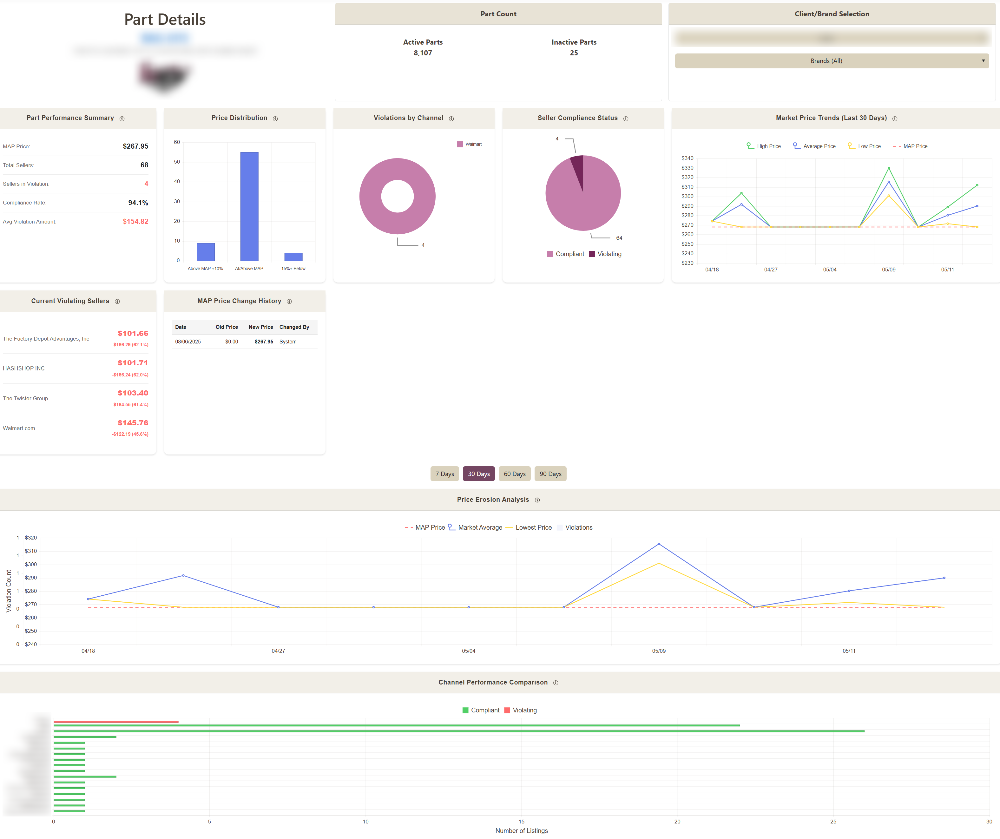
Our dashboard’s product-level data help identify which items are generating the most violations. Rather than treating every product equally, teams can focus first on the products with the highest violation counts, largest dollar impact, or most frequent seller activity. This allows enforcement efforts to be prioritized around the issues most likely to affect brand value, reseller trust, and revenue protection.
The detailed product table adds another layer of usefulness by showing information such as product number, MAP price, last violation date, seller groups violating, violation amount, average advertised price, percentage below MAP, estimated lost revenue, and channels involved. This turns dashboard data into a practical work queue. Teams can quickly decide which products require outreach, documentation, escalation, or continued monitoring.
Better Channel and Seller Intelligence
Our channel-level data helps teams understand where violations are happening most often. By comparing marketplace activity, independent websites, and other selling channels, our clients can see which areas require the most attention. This is especially valuable because each channel may require a different enforcement approach. Large marketplaces may require seller identification and repeated documentation, while direct seller websites may allow for more immediate communication.
Over time, this data helps reveal recurring patterns across seller groups, product categories, and sales channels. If a small number of channels or seller groups account for a large share of violations, teams can concentrate resources where they will have the greatest impact.
Together, these dashboard insights help transform MAP monitoring from a reactive process into a measurable, prioritized, and client-ready enforcement strategy.
At MAP Services Corp, smarter data helps manufacturers move beyond reactive policing and toward proactive channel management that protects both brand equity and dealer relationships.
MAP Services Corp, Protecting Brand Value Through Smarter MAP Enforcement Strategies
Learn More About Our MAP Monitoring & Enforcement Solutions